Update: I made a major error in the algebra of estimating “white diabetes rates” per county. So the last set of correlations was junk. I think fixed the issue. Thanks to “bayesian” who noted that something was off with them.
The CDC provides data on diabetes by county as well as obesity.
Some Correlations:
Diabetes-Obesity = 0.72
Diabetes-Black = 0.65
Diabetes-Latino = -0.14
What’s going on with the last? Latinos, in particular Mexican Americans, are more susceptible to diabetes than whites. So it must be that in counties where there are many Mexican Americans, white have particularly low prevalence of diabetes.
Other correlations:
Diabetes-Obama Vote = -0.01
Diabetes-College Educated = -0.46
Diabetes-Median Household Income = -0.45
Diabetes-Median Home Value = -0.42
I’m struck by the fact that the correlations are higher than for obesity (if you think about it in terms of r-squared, the square of the correlation explaining the variance of Y by X, it’s even more striking). Probably has to do with the fact that only a subset of the obese are diabetic, as diabetes is a more extreme manifestation of morbidity. Let’s control for the % black in a county with partial correlations:
Diabetes-Obesity = 0.63
Diabetes-Obama Vote = -0.28
Diabetes-College Educated = -0.52
Diabetes-Median Household Income = -0.41
Diabetes-Median Home Value = -0.43
Not much change in the correlations really. Also, now there is a modest correlation between political liberalism and lower levels of diabetes now that the black proportion is controlled (the correlation with black proportion controlled for obesity and Obama vote is -0.24, same magnitude and direction).
I also tried to estimate white diabetes prevalence by county. The national data suggest that blacks are 1.7 times more likely to be diabetic, and Latinos 2 times more likely. Obviously there’s going to be some variance for these two groups, so I don’t know how useful this estimate for whites is going to be. But, it should put into stark relief the negative correlation between the proportion of Latinos and white diabetic rates (note: again, Latinos seem to vary quite a bit and there are many counties along the Mexican-American border, as well as on the East Coast, where Latinos are so far deviated from the aggregate risk that I had to dump the data).
Here are some correlations (again, white county proportions are estimates):
White diabetic proportion-White obesity rate (estimate from previous post) = 0.47
White diabetic proportion-College Educated = -0.46
White diabetic proportion-Obama Vote = -0.18
White diabetic proportion-Median Household Income = -0.39
White diabetic proportion-Median Home Value = -0.44
OK, enough with correlations. Maps. Diabetes for all groups:

Now, my estimates for whites:

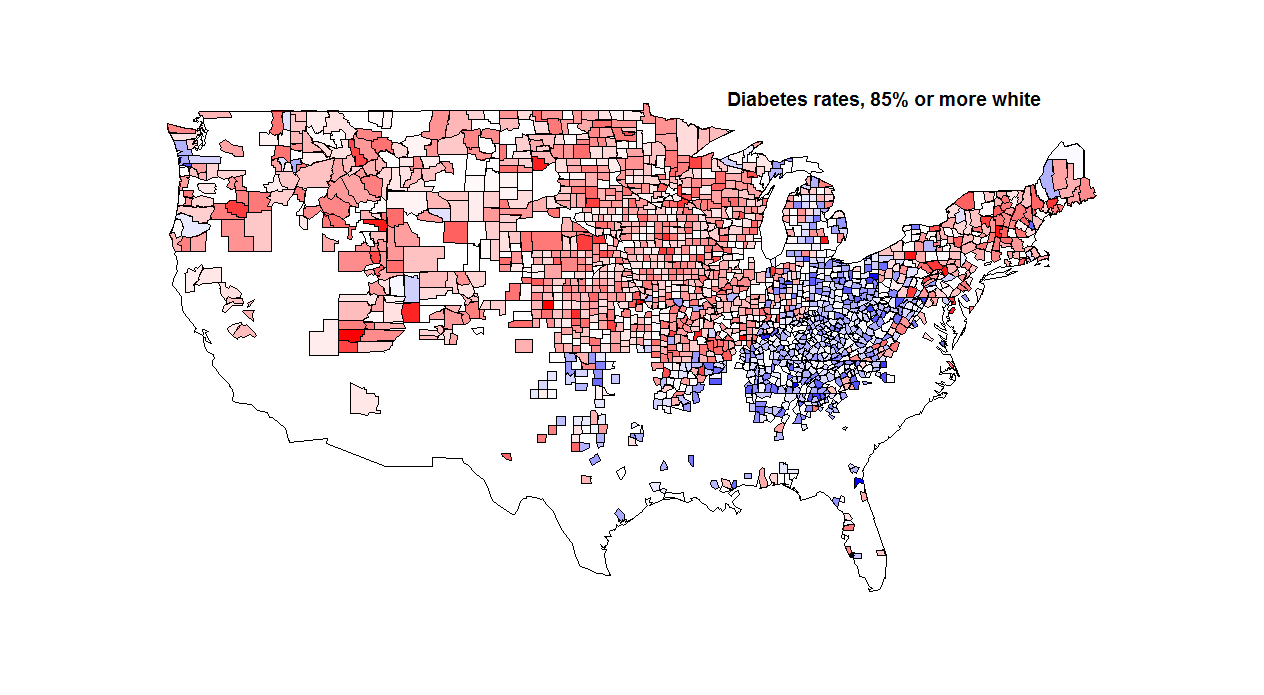
I think the assumption of an invariant relationship between white and non-white rates (i.e., blacks = 1.7 X whites) is causing problems. The white areas underneath the median suspiciously concentrated in the Black Belt.
So let’s just focus on counties which are 85% or more white: